How To Guides
Step-by-step walkthroughs for every part of MarTech — from your first setup to the full 6-month roadmap for building out your stack.

How to Build a Custom Dashboard to Track Your Marketing KPIs
Most small businesses have plenty of marketing data. The problem is that it's scattered: leads in one place, deals in another, appointments on a calendar, and ad results in yet another login. By the time someone pulls it all together, the numbers are a week old and nobody has time to act on them.
A custom dashboard fixes that. In MarTech by Ajax Union, you can build a dashboard that shows your leads, pipeline, and appointments side by side, updates on its own, and opens every time you log in. This guide walks through which KPIs to track, how to build the dashboard, and how to set up each widget so the numbers actually answer your questions.
Why one dashboard beats five reports
A dashboard isn't just a convenience. When your key numbers sit on one screen, you start to see how they connect:
A jump in new leads that doesn't show up as booked appointments points to a follow-up problem, not a marketing problem.
A full pipeline with a low win rate points to your sales process, not your lead flow.
A rising no-show rate tells you to look at reminders before you spend more on ads.
MarTech dashboards are built from widgets: small cards that each show one metric as a number, chart, or table. You choose which widgets to add, how each one is configured, and how they're arranged. You can also create separate dashboards for different needs, such as one for marketing and one for sales.
Choose your marketing KPIs first
Before you open the dashboard editor, decide what questions the dashboard needs to answer. A dashboard with 30 widgets is just a different kind of clutter. For most service businesses, a strong marketing dashboard covers four areas.
Question | Widgets to look for |
How many new leads are we getting? | Total Contacts Count (This Month), Contacts by source |
Where are leads coming from? | Lead Source Report |
How healthy is our pipeline? | Opened Opportunities, Opened Opportunity Value, Stages Distribution, Funnel |
Are leads turning into customers? | Won Opportunities, Conversion Rate |
Are leads showing up for appointments? | Booked Appointments, Showed Appointments, No Show Appointments, No Show Rate Over Time |
What's coming up this week? | Upcoming Appointments (Week) |
Is our website bringing people in? | Unique Website Views, Total Opt-ins (All Funnels) |
Start with six to ten widgets that match your goals. You can always add more once you've used the dashboard for a few weeks and know what's missing.
If you run paid ads, MarTech also has Facebook Ads Report and Google Ads Report widgets that show clicks, spend, click-through rate, and cost per click. These need your ad accounts connected first.
Step 1: Create a new dashboard
In MarTech, select Dashboard from the left menu.
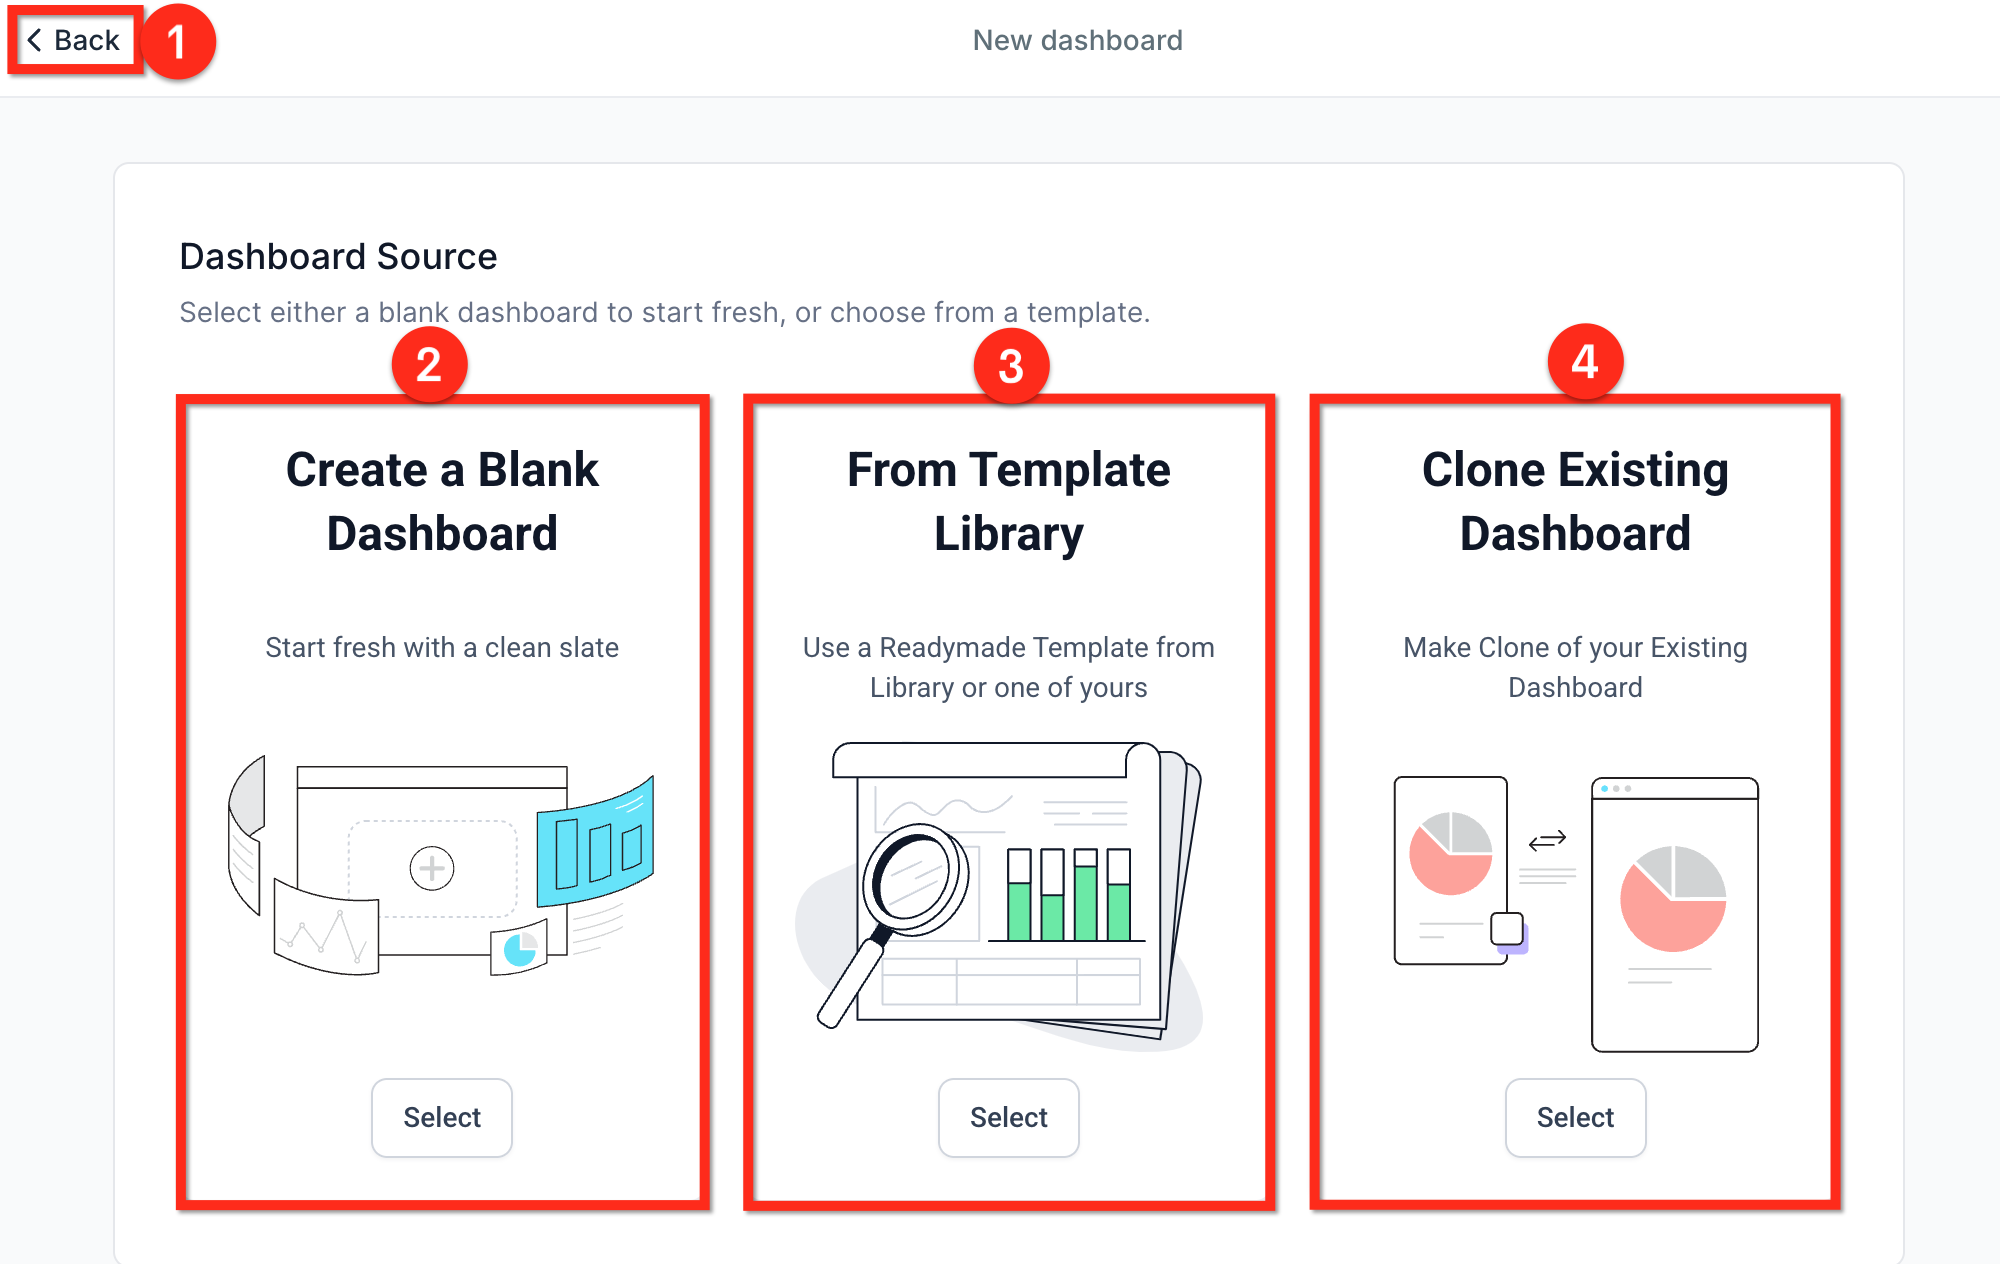
Open the Dashboard Selection menu and click + Add Dashboard.
how to start:
Create a Blank Dashboard to build from scratch.
From Template Library to start from a ready-made layout.
Clone Existing Dashboard to copy one you already have.
Enter a Dashboard Name, such as "Marketing KPIs."
Set who can see it. Turn the Private Dashboard toggle on to keep it to yourself, or leave it off and choose an access level for each user role: Full, Edit, View, or No Access.
Click Confirm.
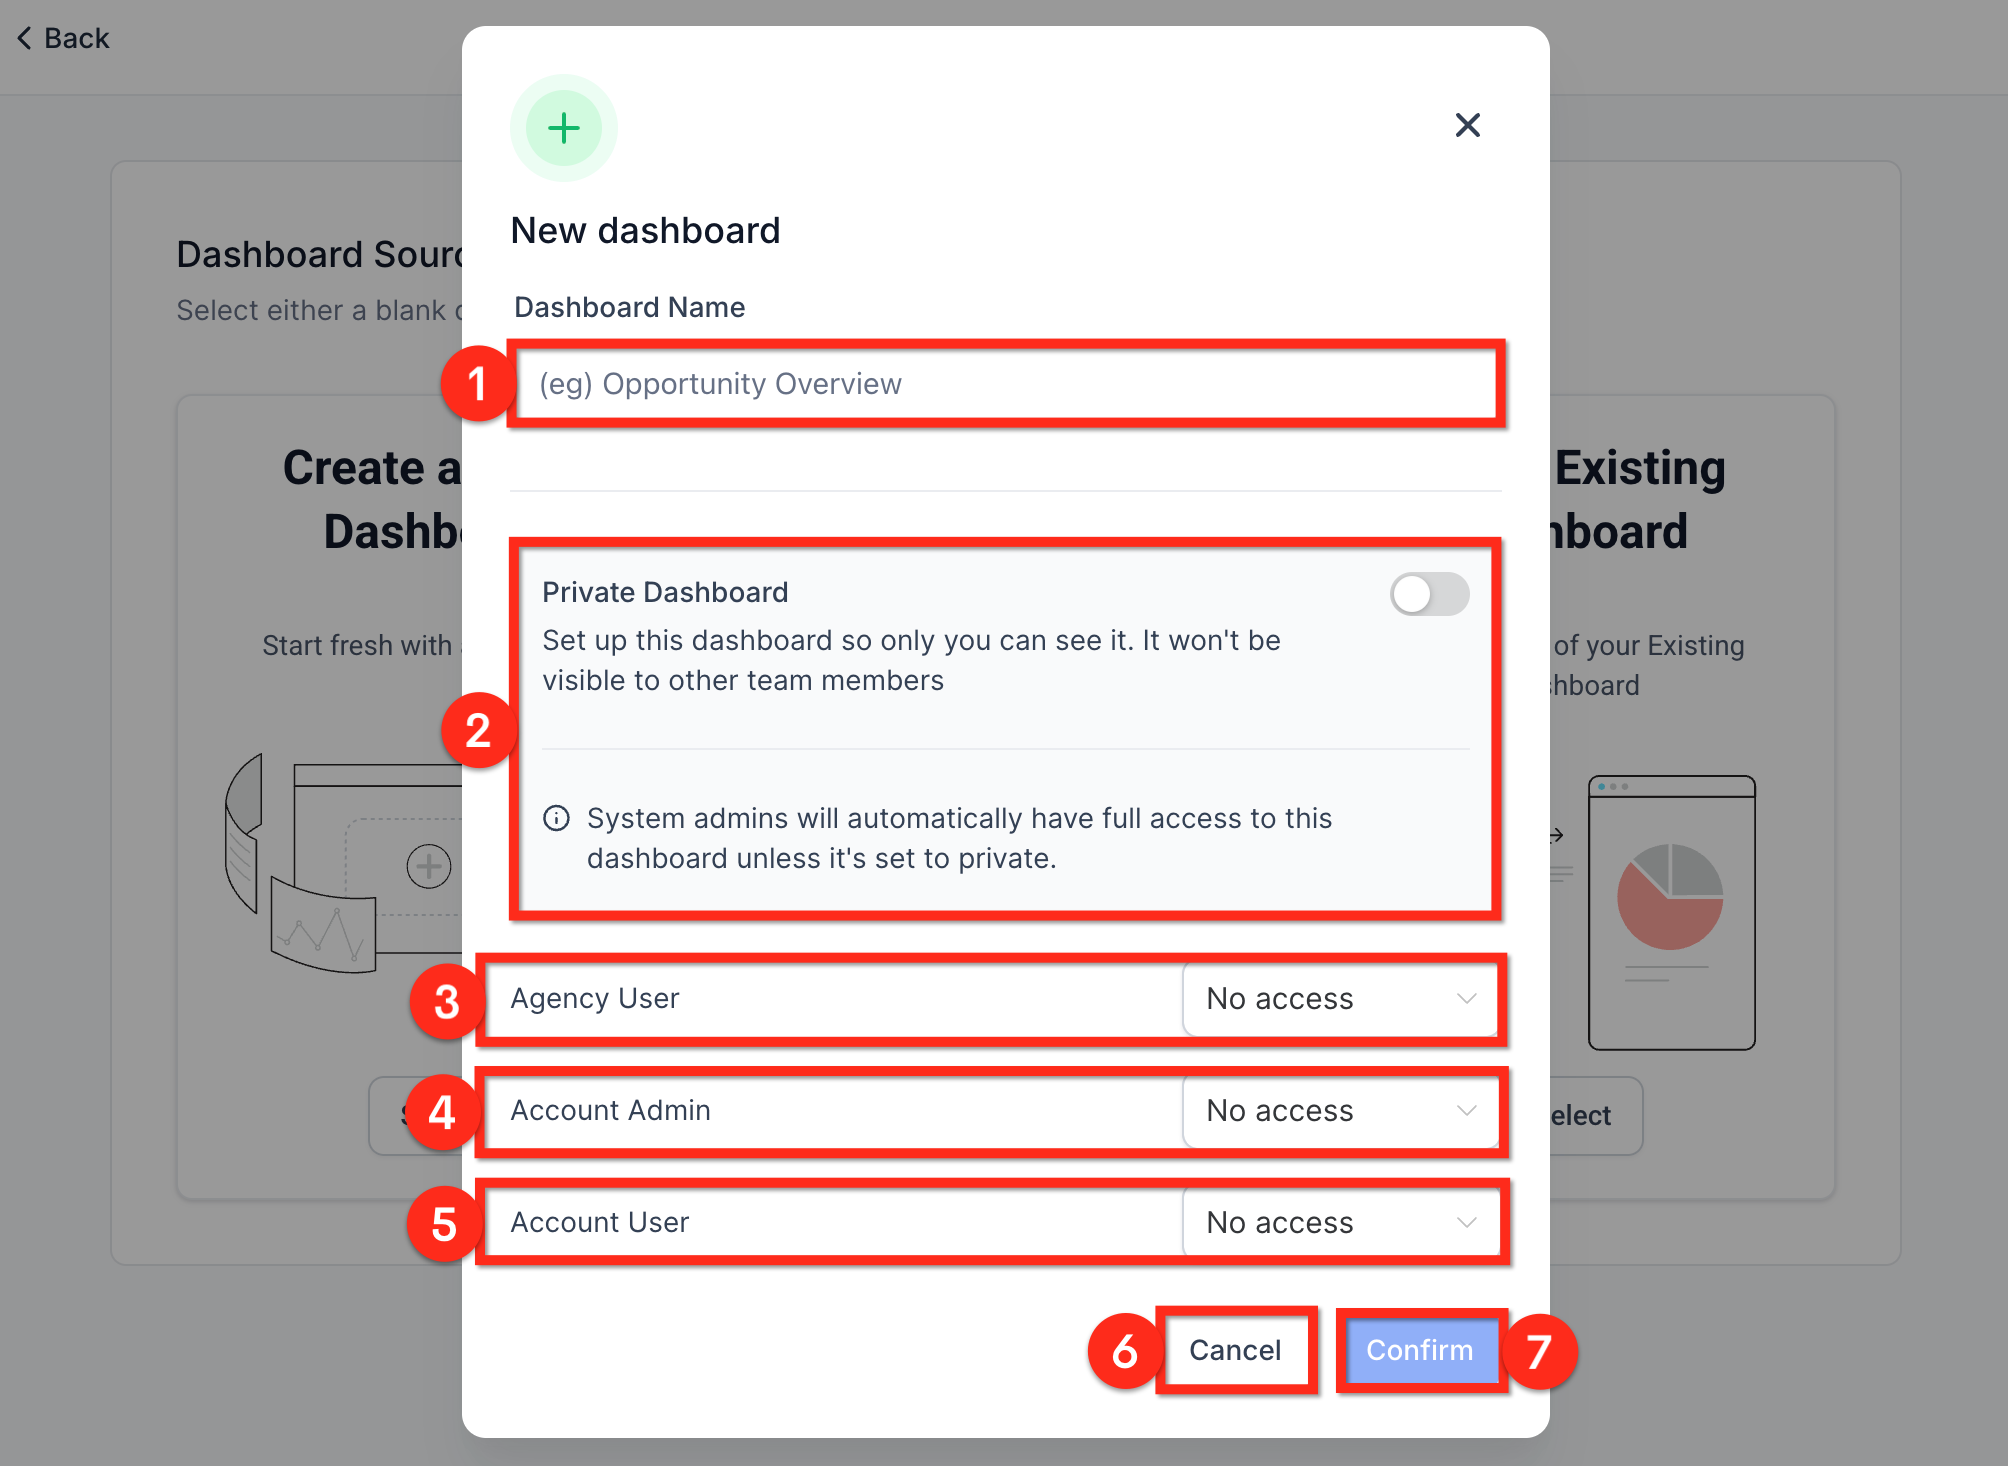
A note on access: anyone who needs to add or change widgets needs Edit or Full access. View access is read-only, which works well for team members who only need to check the numbers.
Step 2: Add widgets from the Widget Gallery
An empty dashboard shows a few quick-start options. You can pick a business goal under What is your goal? or choose from Top used widgets, then click Confirm & Add. That's a fast way to get started, but for a focused marketing dashboard, adding widgets yourself gives you more control.
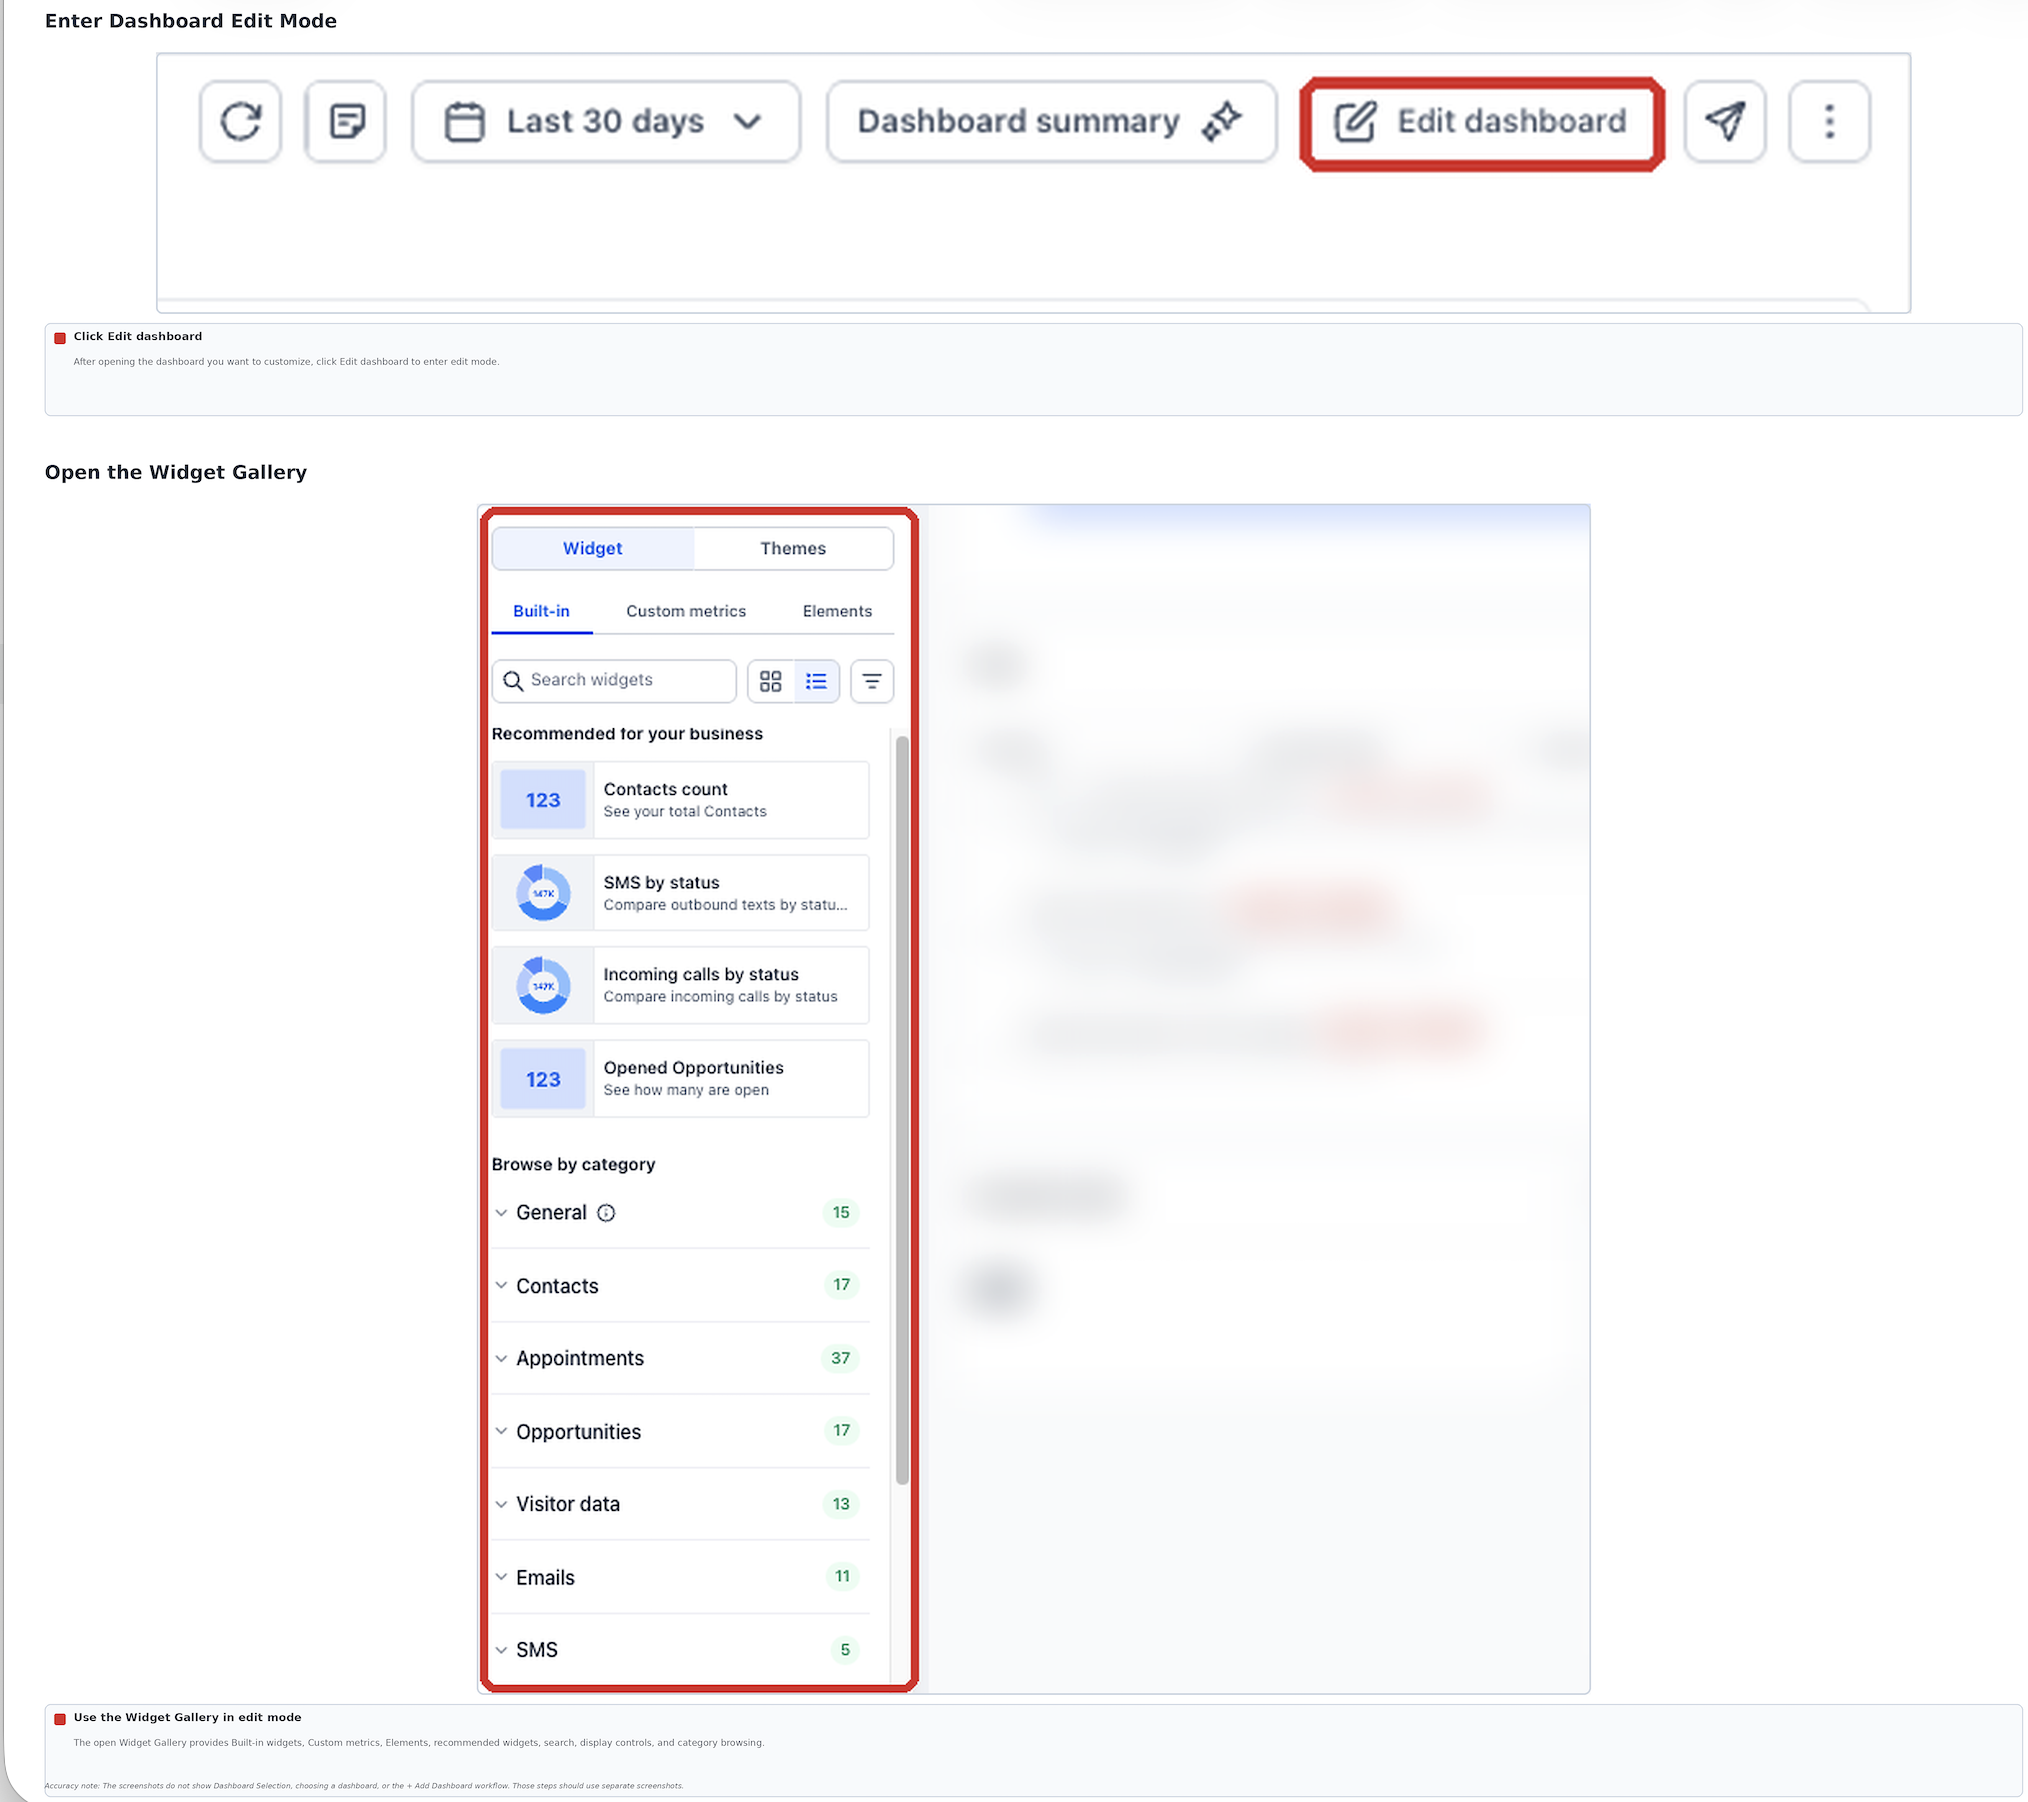
Click Edit Dashboard to enter Edit mode.
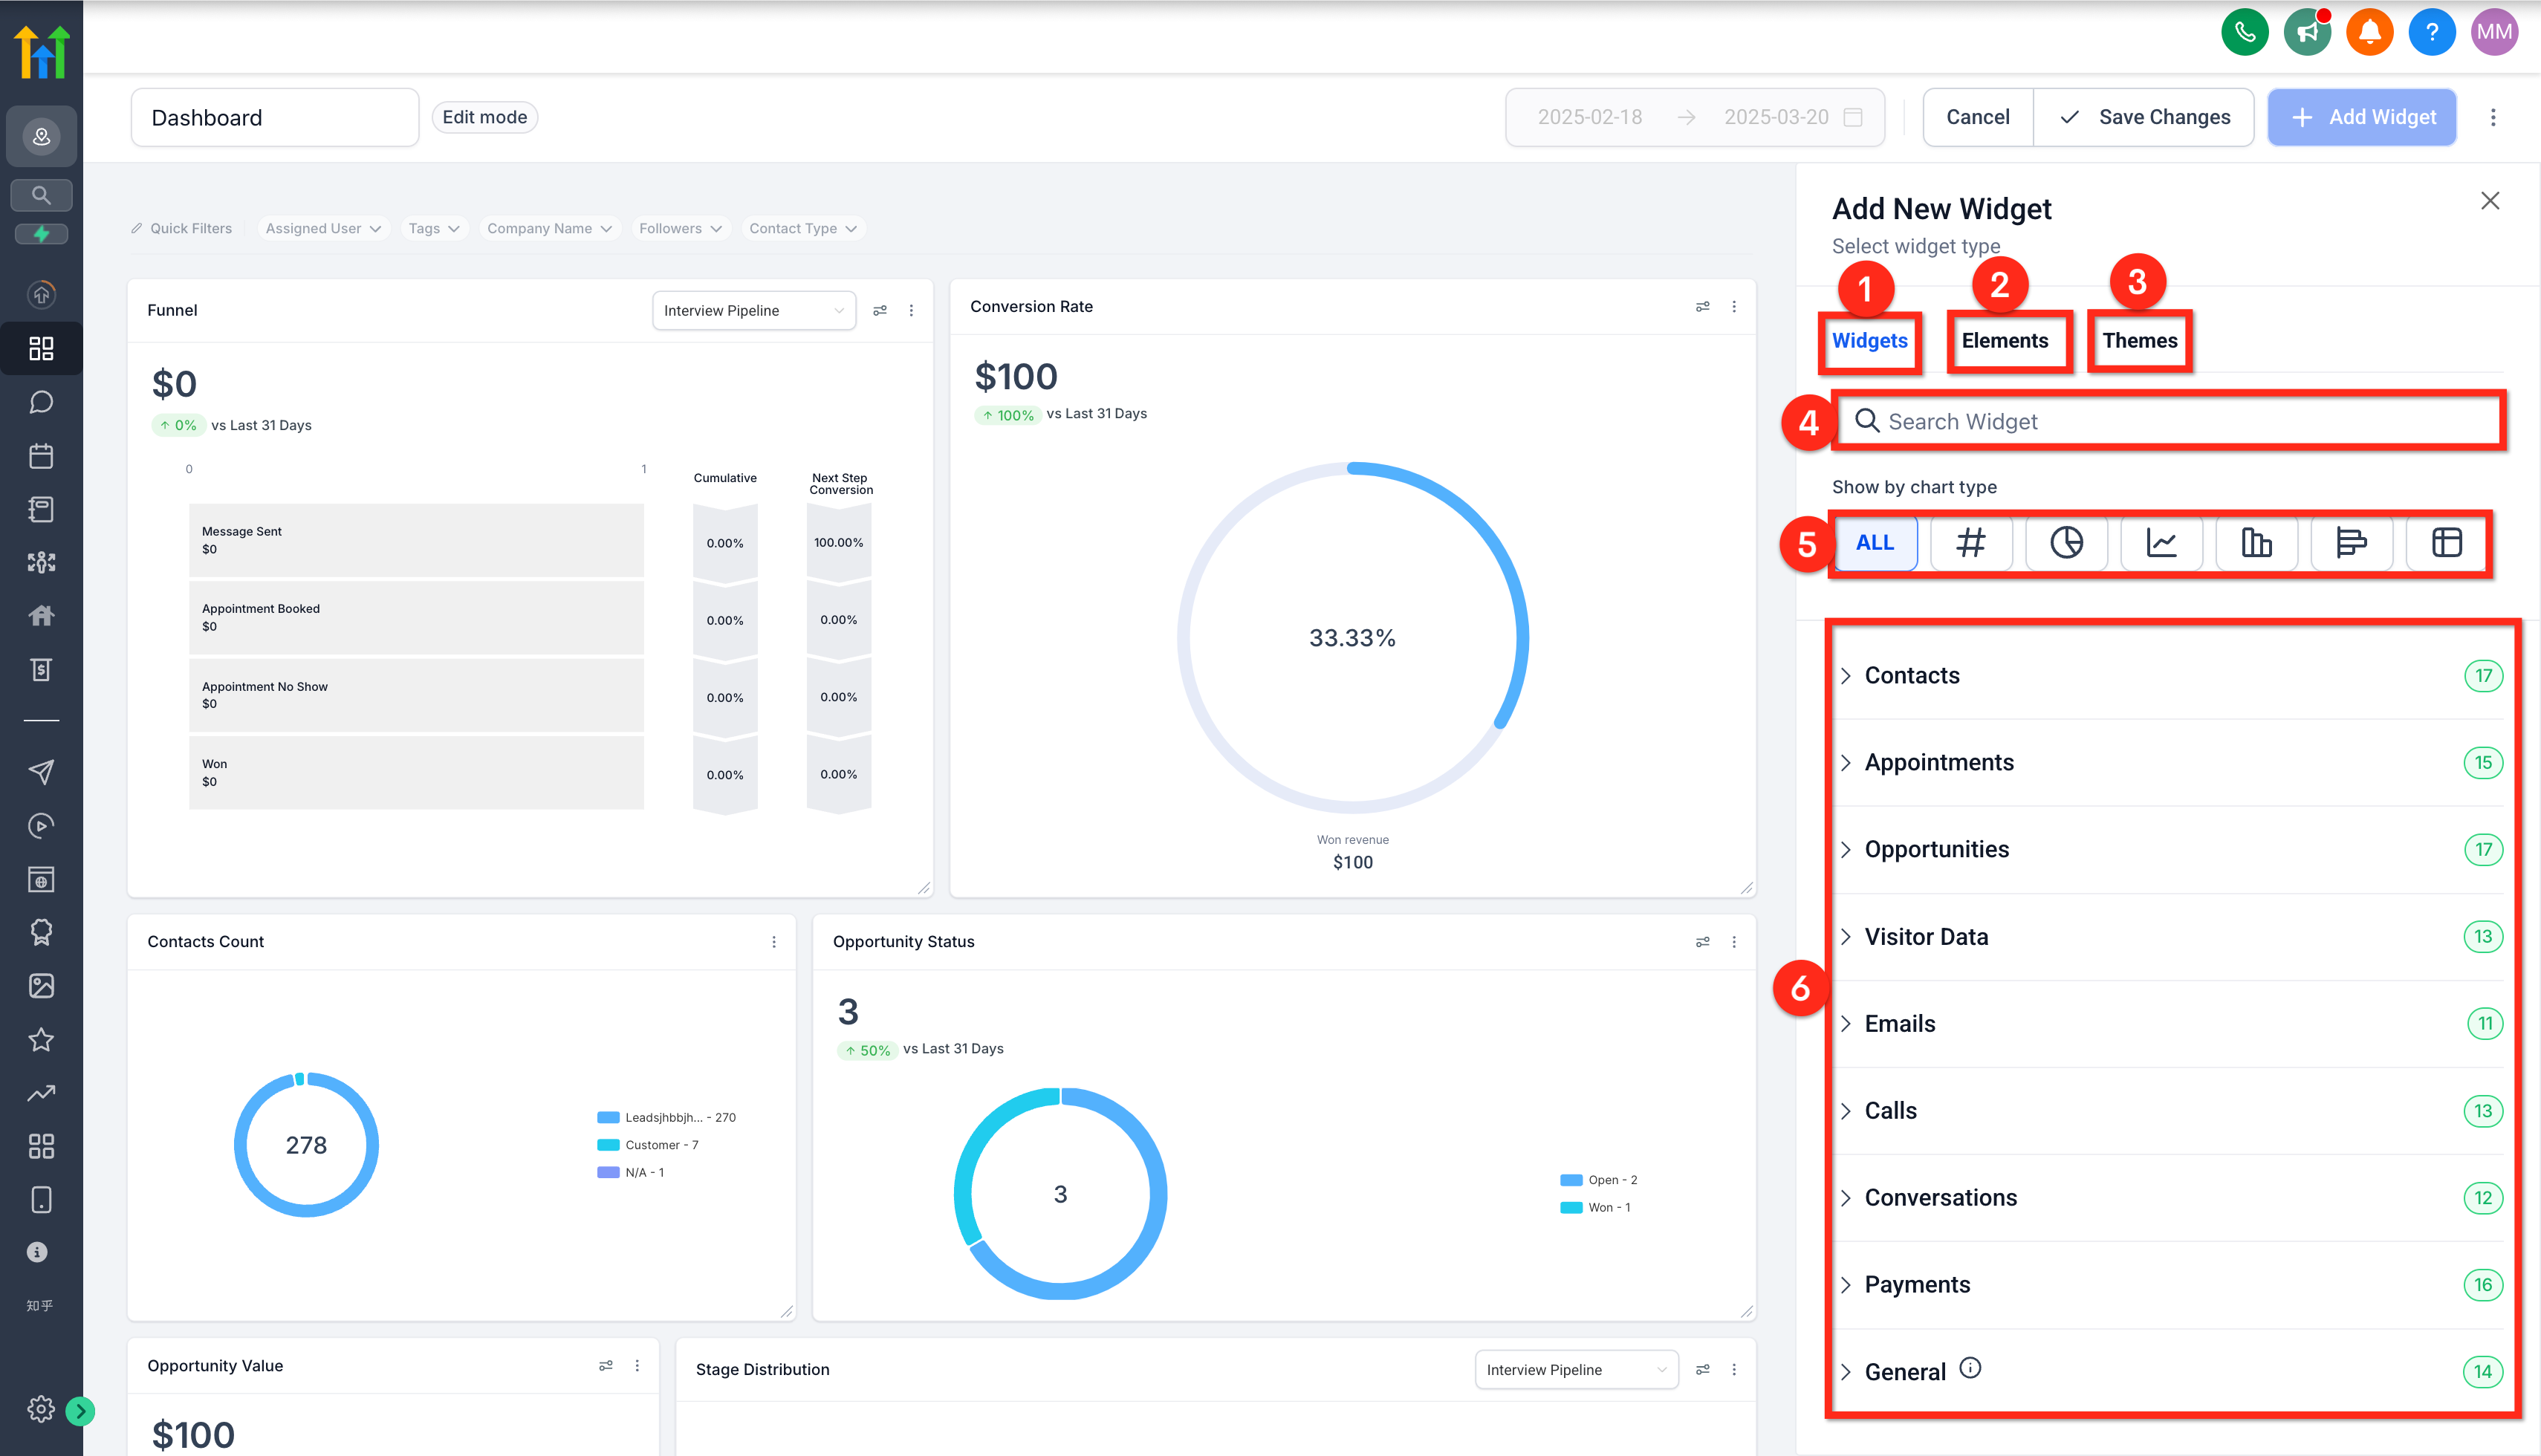
Open the Widget Gallery.
Find the widgets on your KPI list. You can:
Browse Recommended for your business, which suggests widgets based on your account activity.
Type a goal or keyword into Search widgets. For example, searching "no show" brings up the appointment no-show widgets.
Use the filter control to narrow by module, such as Contacts, Opportunities, or Appointments.
Switch between Gallery view (larger chart previews) and List view (compact names and descriptions) as you prefer. Click the information icon on any widget to see exactly what it measures.
Select a widget to add it to your dashboard. Repeat for each widget on your list.
Step 3: Configure each widget
A widget's default settings are a starting point. A few minutes of setup makes each one far more useful.
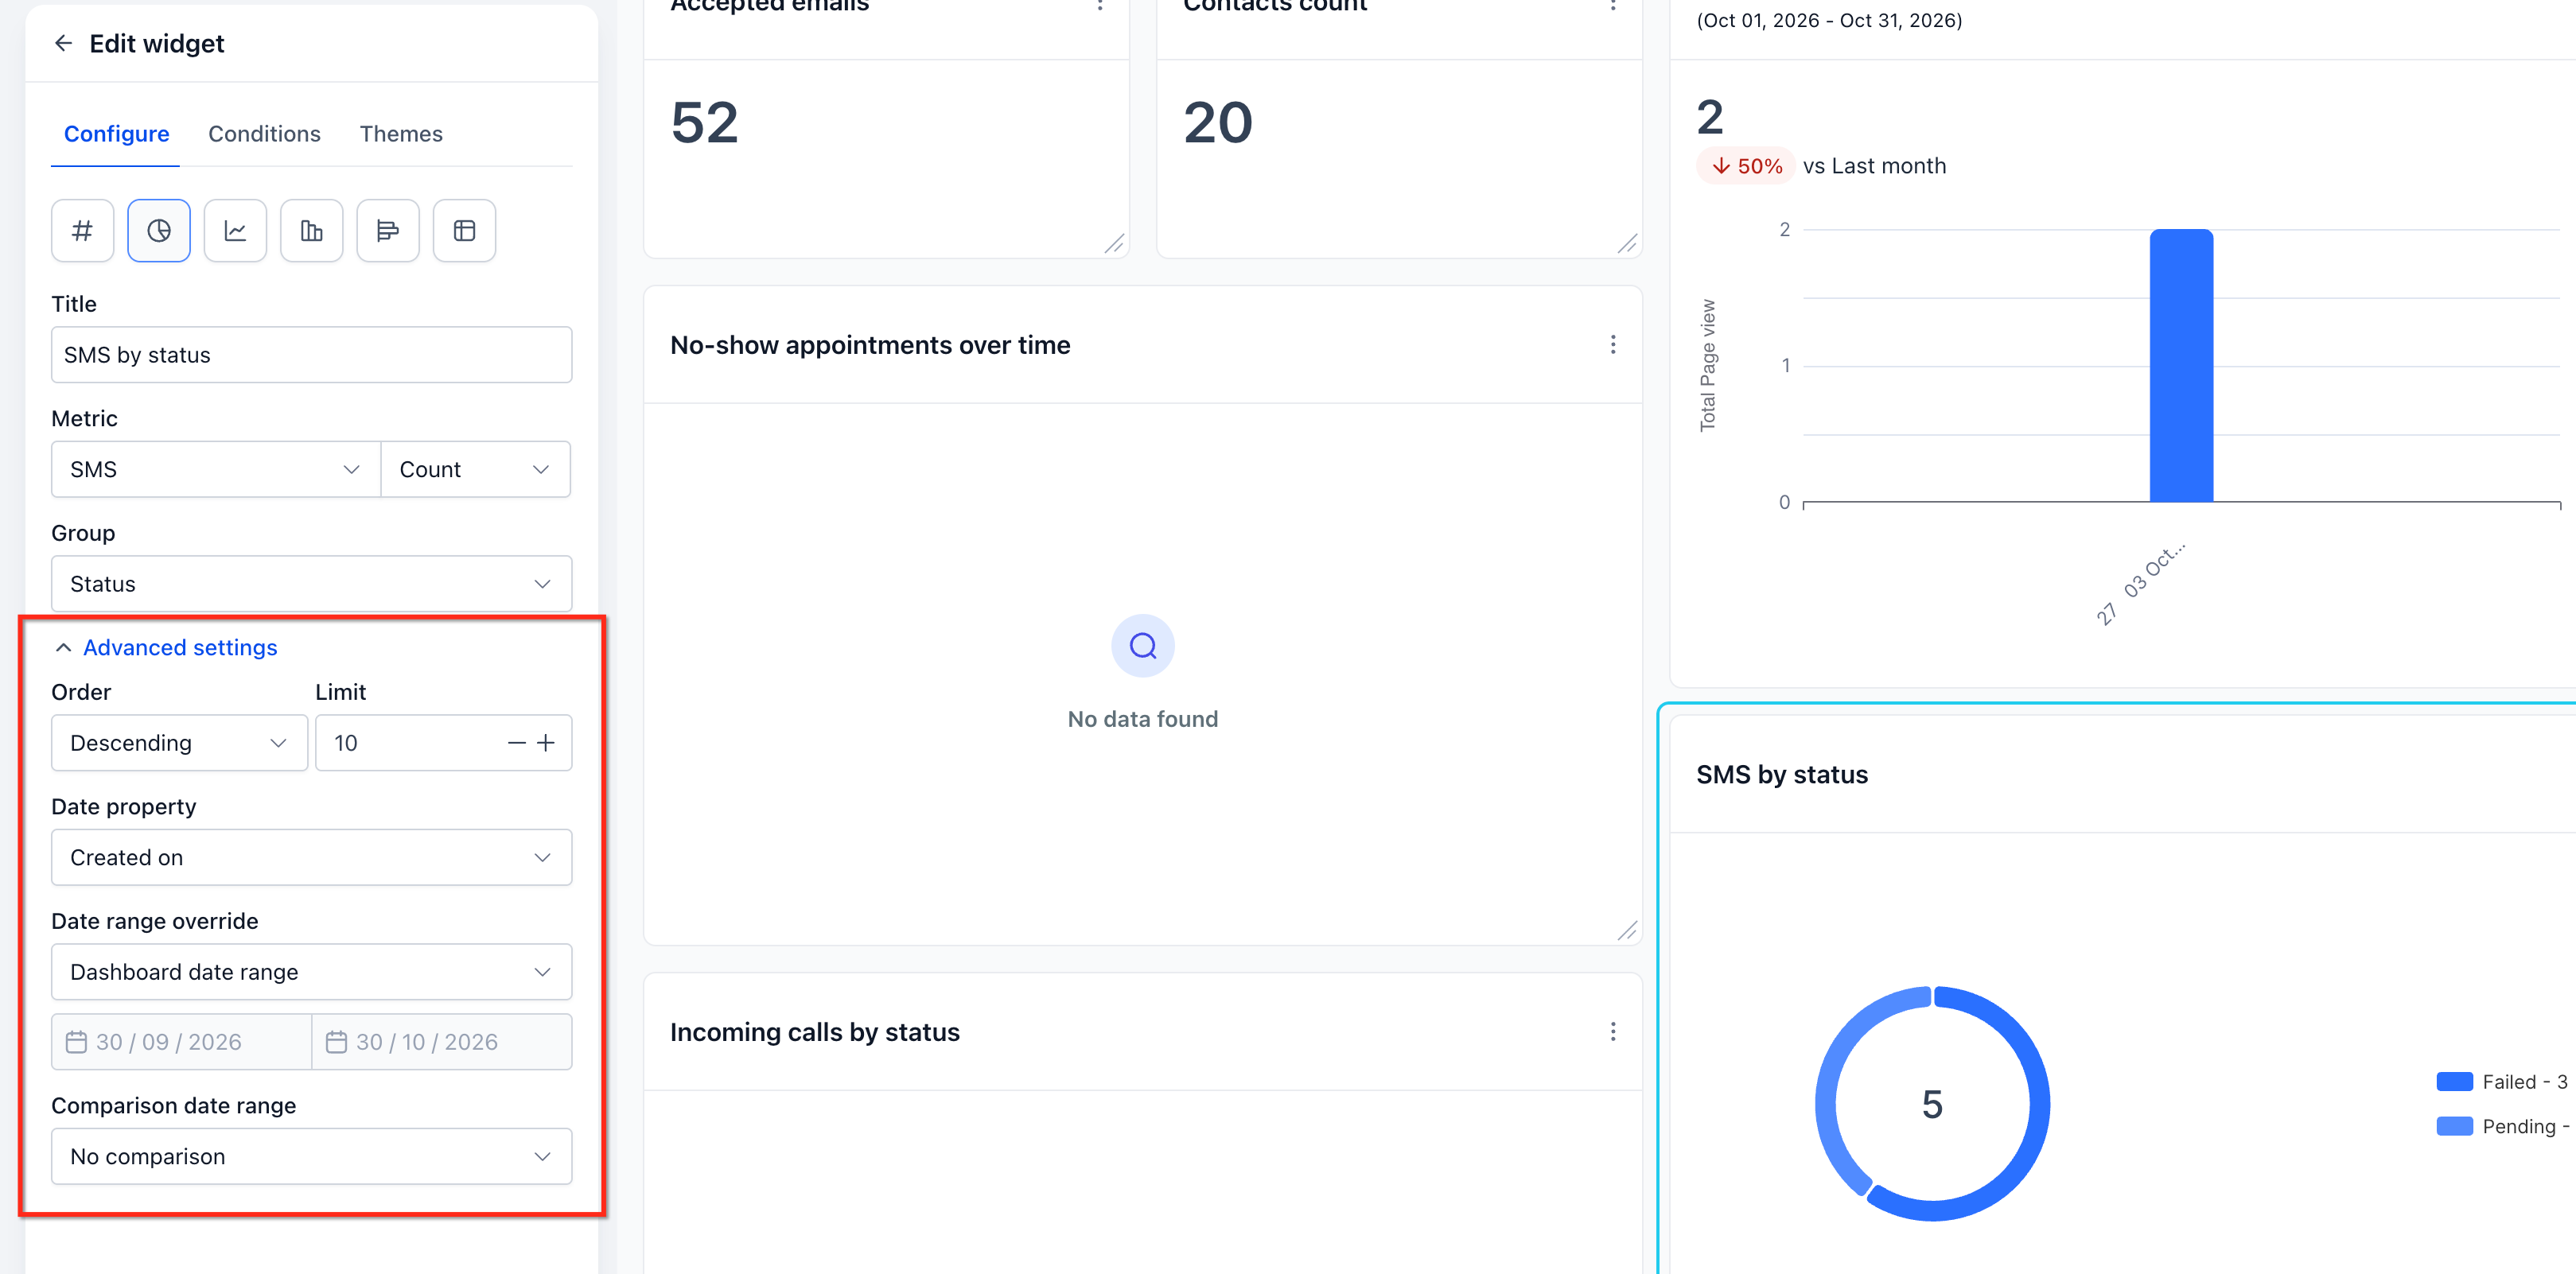
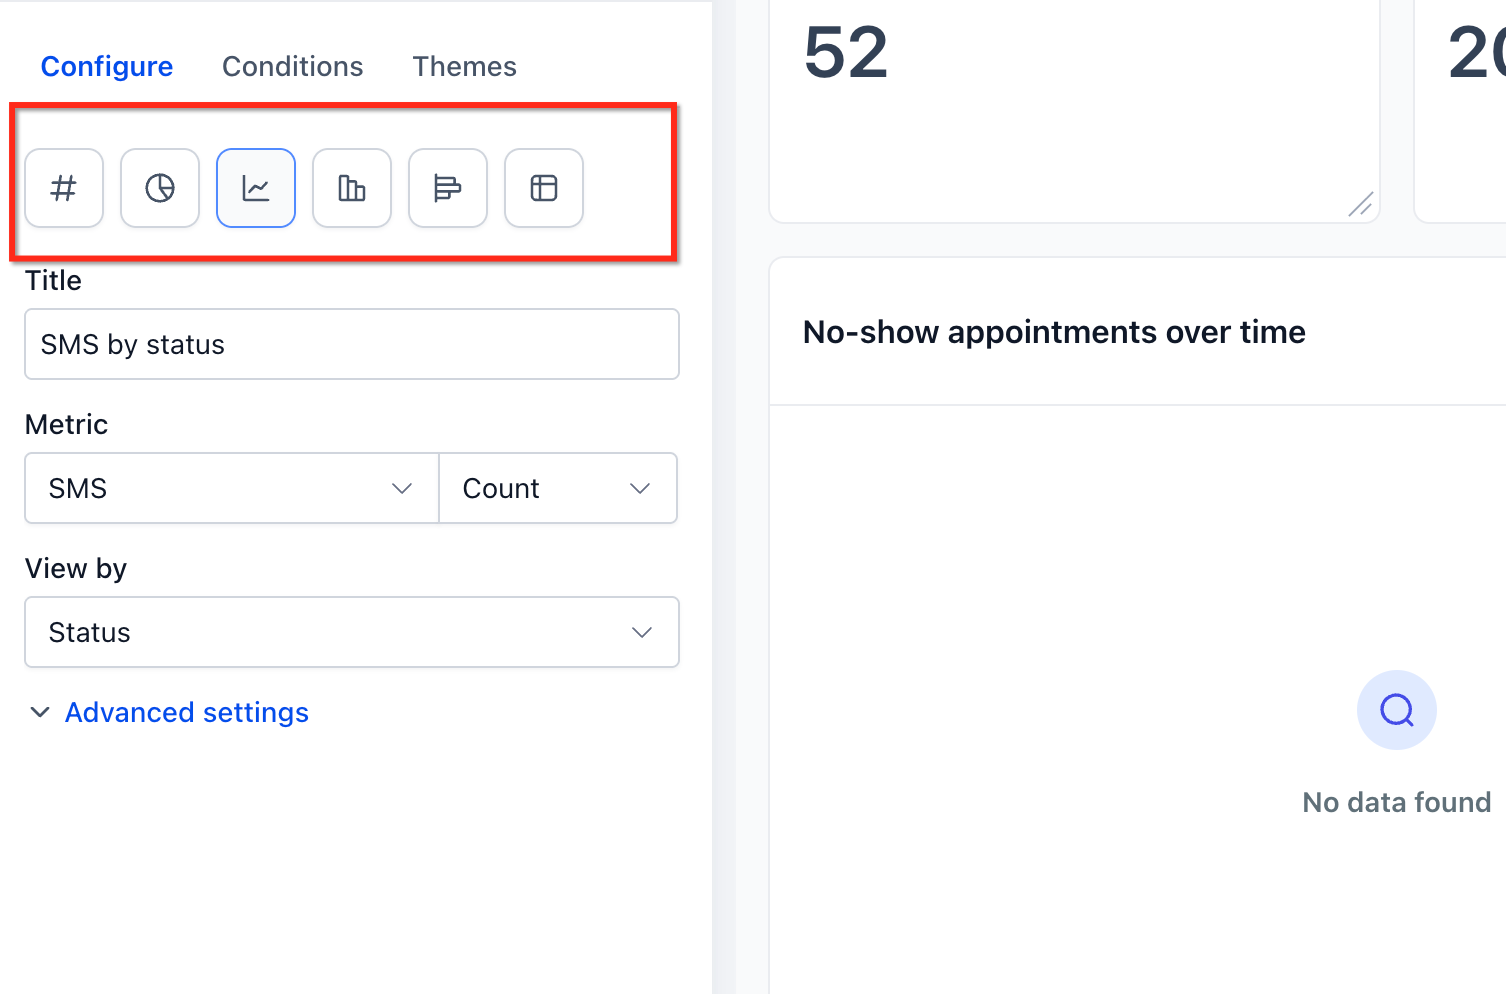
To open a widget's settings, enter Edit mode and select the widget, or open its ⋮ menu and choose Edit widget. Then use the Configure tab. Depending on the widget, you can change:
Title — rename it in plain language, such as "New Leads This Month."
Metrics — choose which data points it shows. Line, bar, and horizontal bar charts can show more than one.
Group and View By — split the data into categories, such as appointments by status.
Breakdown — set how data over time is grouped, such as by week or month.
Date Property — choose which date to count from, such as when a record was created or last updated.
Date Range Override — give this widget its own date range instead of the dashboard's.
Comparison date range — compare against an earlier period to show the percentage change.
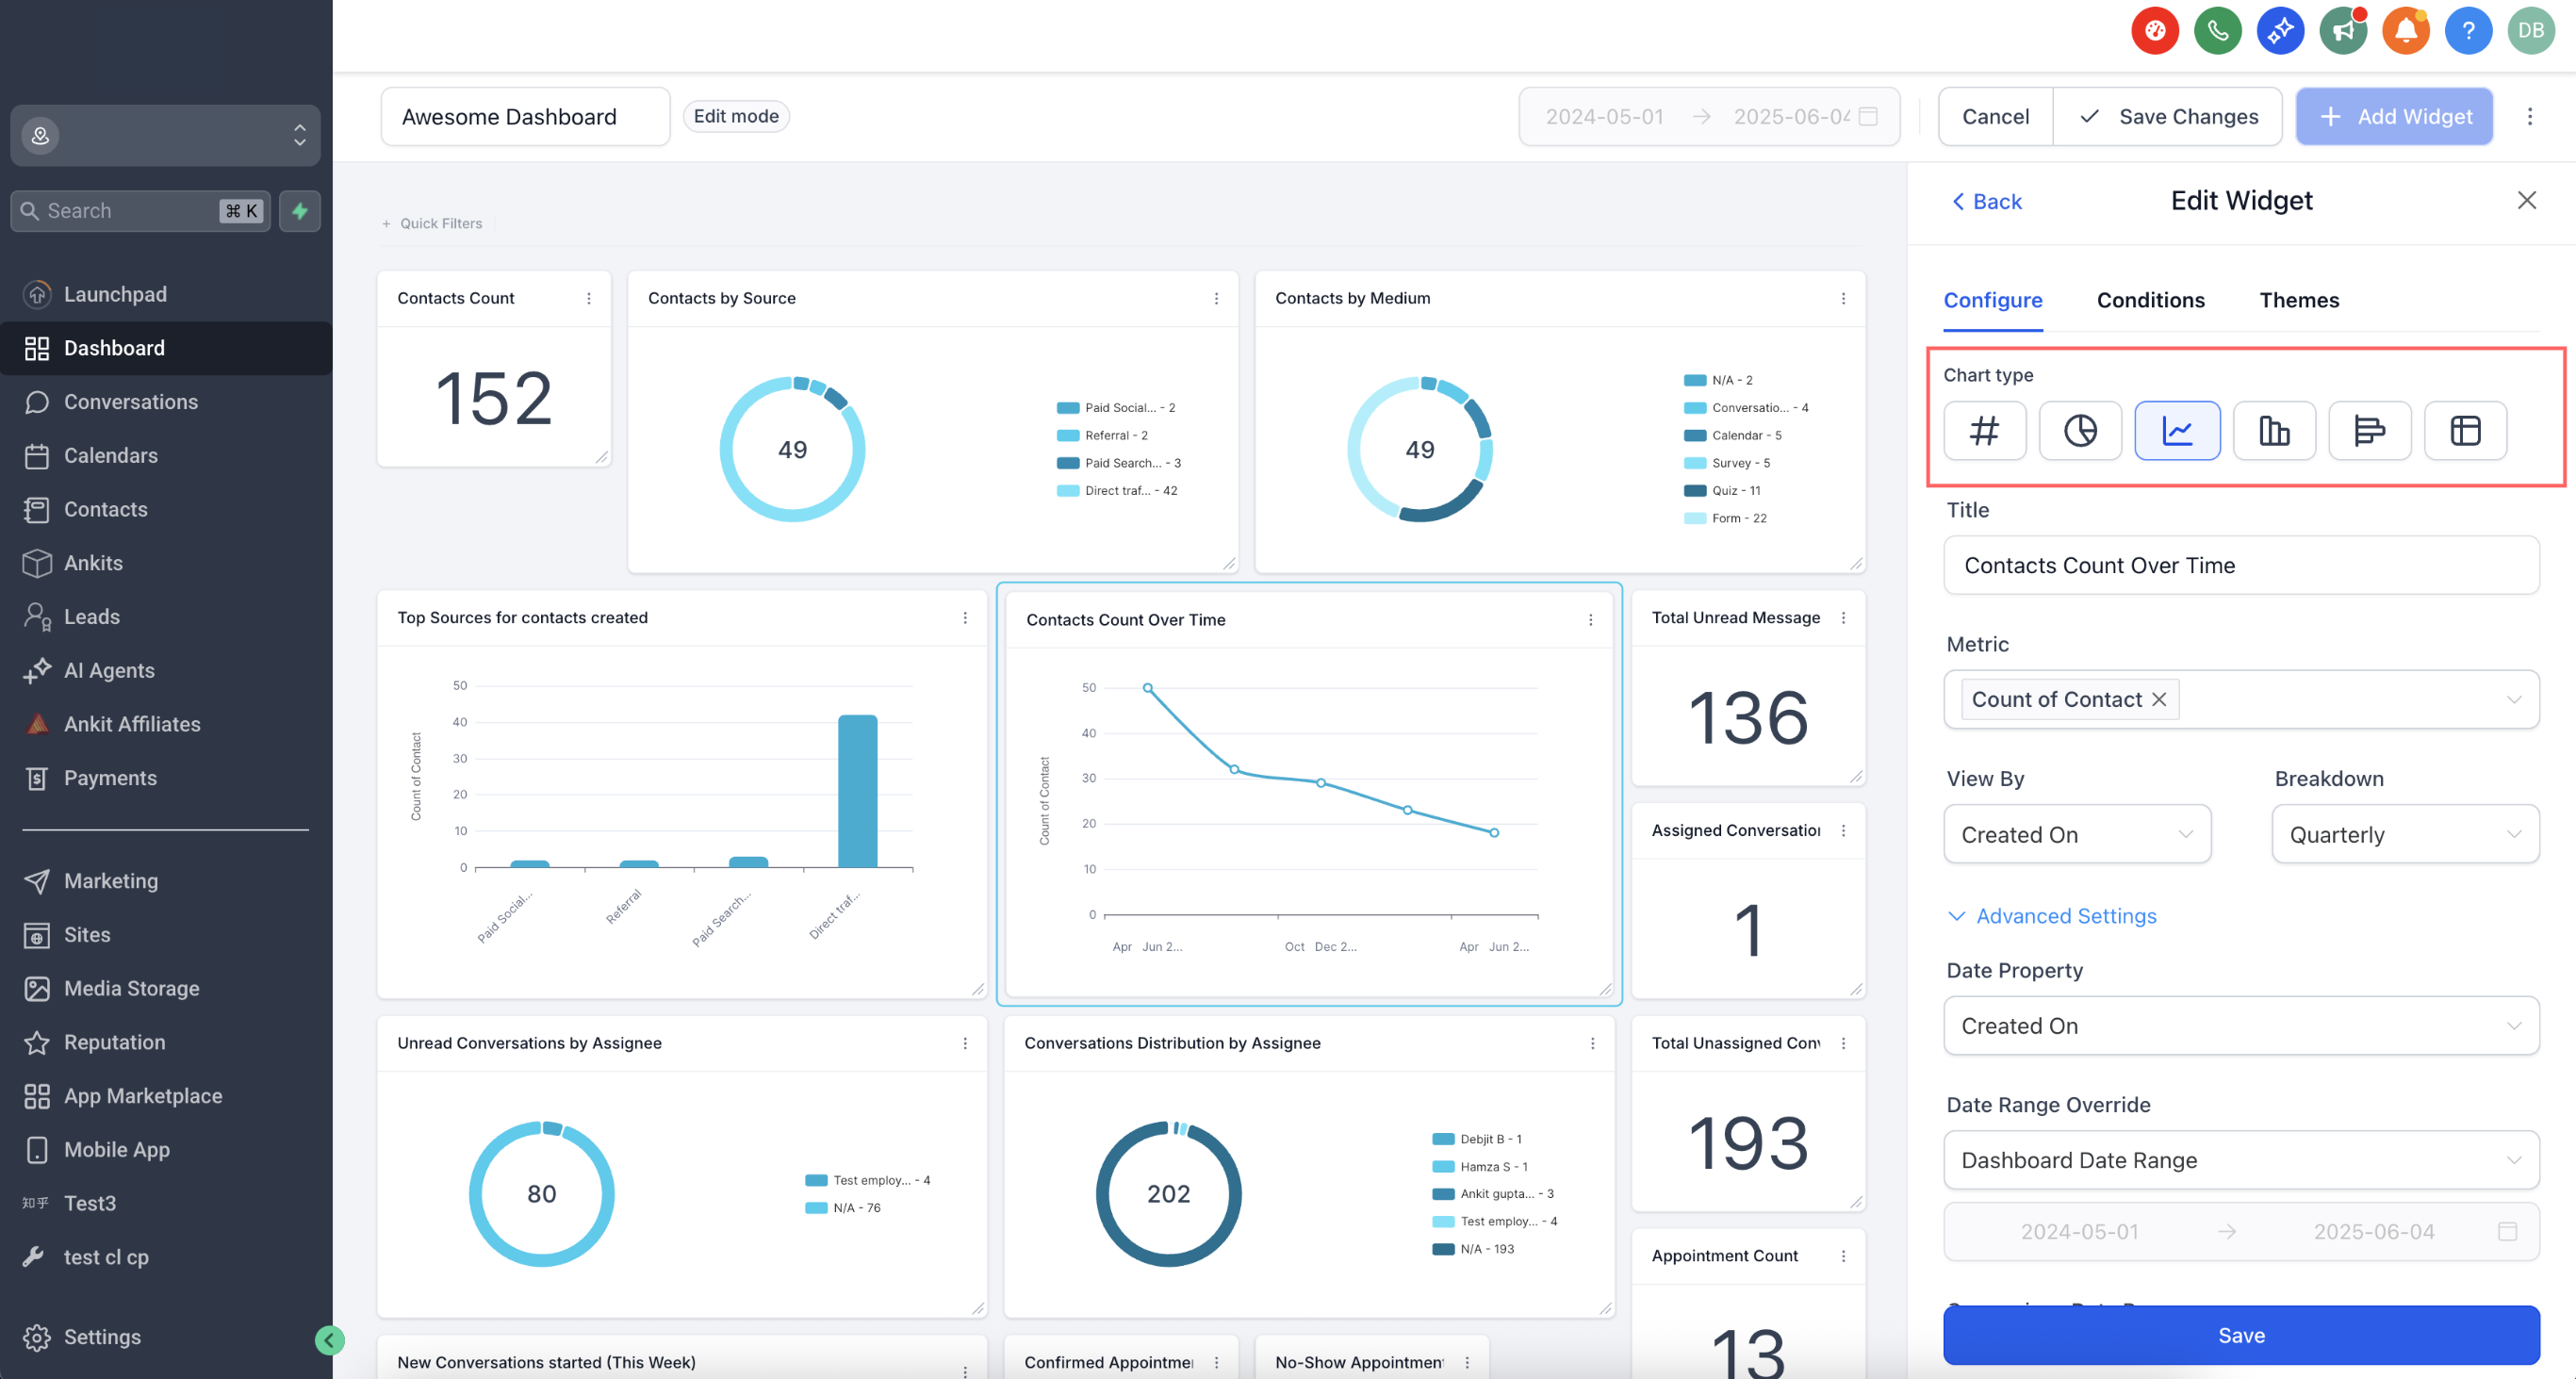
You can also change the chart type, for example from a number to a line chart, and check the preview before saving.
Set the trend color correctly. When a widget has a comparison date range, it shows a trend badge: green for an increase and red for a decrease, by default. For some metrics, a decrease is good news. Open Advanced settings on the Configure tab and choose Decrease is positive for widgets like No Show Rate Over Time, so an improvement shows up green.
Focus widgets with conditions. Use the Conditions tab to filter what a widget counts. Click Add Condition, choose a field, an operator, and a value, then save. For opportunity widgets, set the pipeline you care about. Several General widgets, including Opportunity Status, Opportunity Value, Conversion Rate, and Lead Source Report, also have a Pipeline dropdown inside the widget, so you can look at one pipeline instead of all of them combined.
One thing to know about the Lead Source Report: it counts opportunities, not unique contacts, and groups them by the source recorded on each opportunity. If your workflows don't fill in an opportunity source, those deals show up as N/A.
Step 4: Arrange and organize the layout
In Edit mode, drag widgets by their handle to move them, and drag the lower-right corner to resize them. A layout that reads top to bottom, in the order leads move through your business, is easy to scan:
Top row: Lead flow — new leads this month, leads by source.
Middle row: Pipeline — open opportunities, open pipeline value, stage distribution, won deals.
Bottom row: Appointments — booked, showed, no-shows, upcoming this week.
Use Elements to add section titles and short text notes, such as "Goal: 40 new leads/month," so anyone reading the dashboard knows what good looks like. The Themes tab lets you change the dashboard's colors to match your brand.
In the current dashboard editor, changes save automatically; look for the Saved badge. If you make a mistake, use Undo, or open Version history (the clock icon) to restore an earlier version.
Step 5: Make the dashboard easy for your team to use
A few settings turn your dashboard from a personal tool into a shared one:
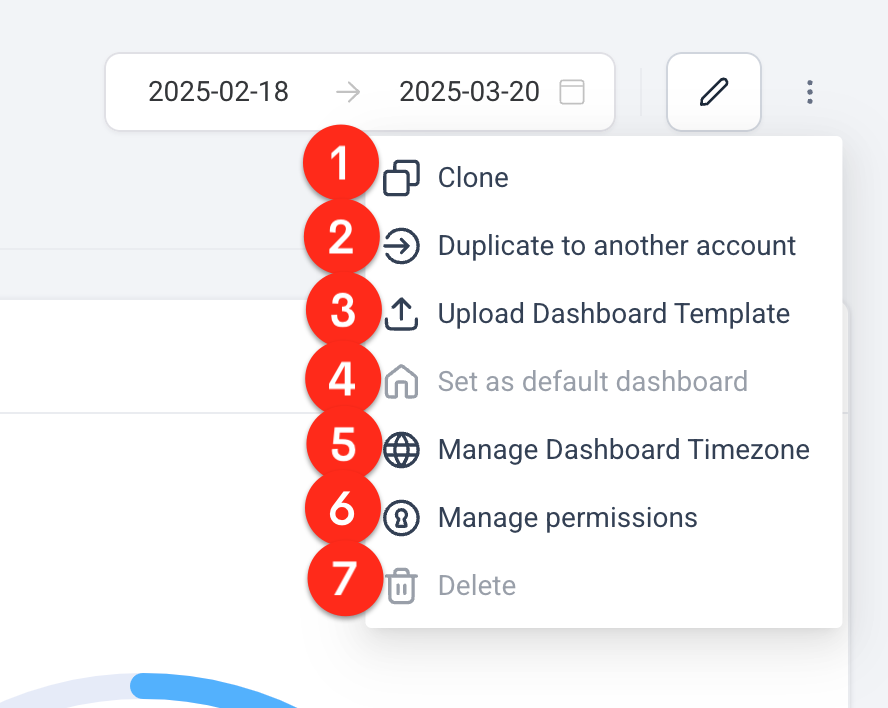
•Set it as the default. From the dashboard's ⋮ action menu, choose Set as default dashboard so it's the first thing everyone sees on the Dashboard page. Make sure it works for all users before you do.
•Adjust permissions later. Use Manage permissions in the same menu to change who can view or edit it. Only the dashboard owner can change these settings.
•Pin it. Click the pushpin icon in the dashboard list to keep it at the top.
•Add quick filters. Quick filters appear as filter pills at the top of the dashboard, so viewers can narrow supported widgets using fields from the dashboard's data sources without editing anything. You can add up to five.
How to read your dashboard each week
With the dashboard built, reading it takes a few minutes:
Set the date range. Use the date picker at the top. Your selection is saved for you, so the dashboard opens with the same range next time. Add a comparison range to see how this period stacks up against the last one.
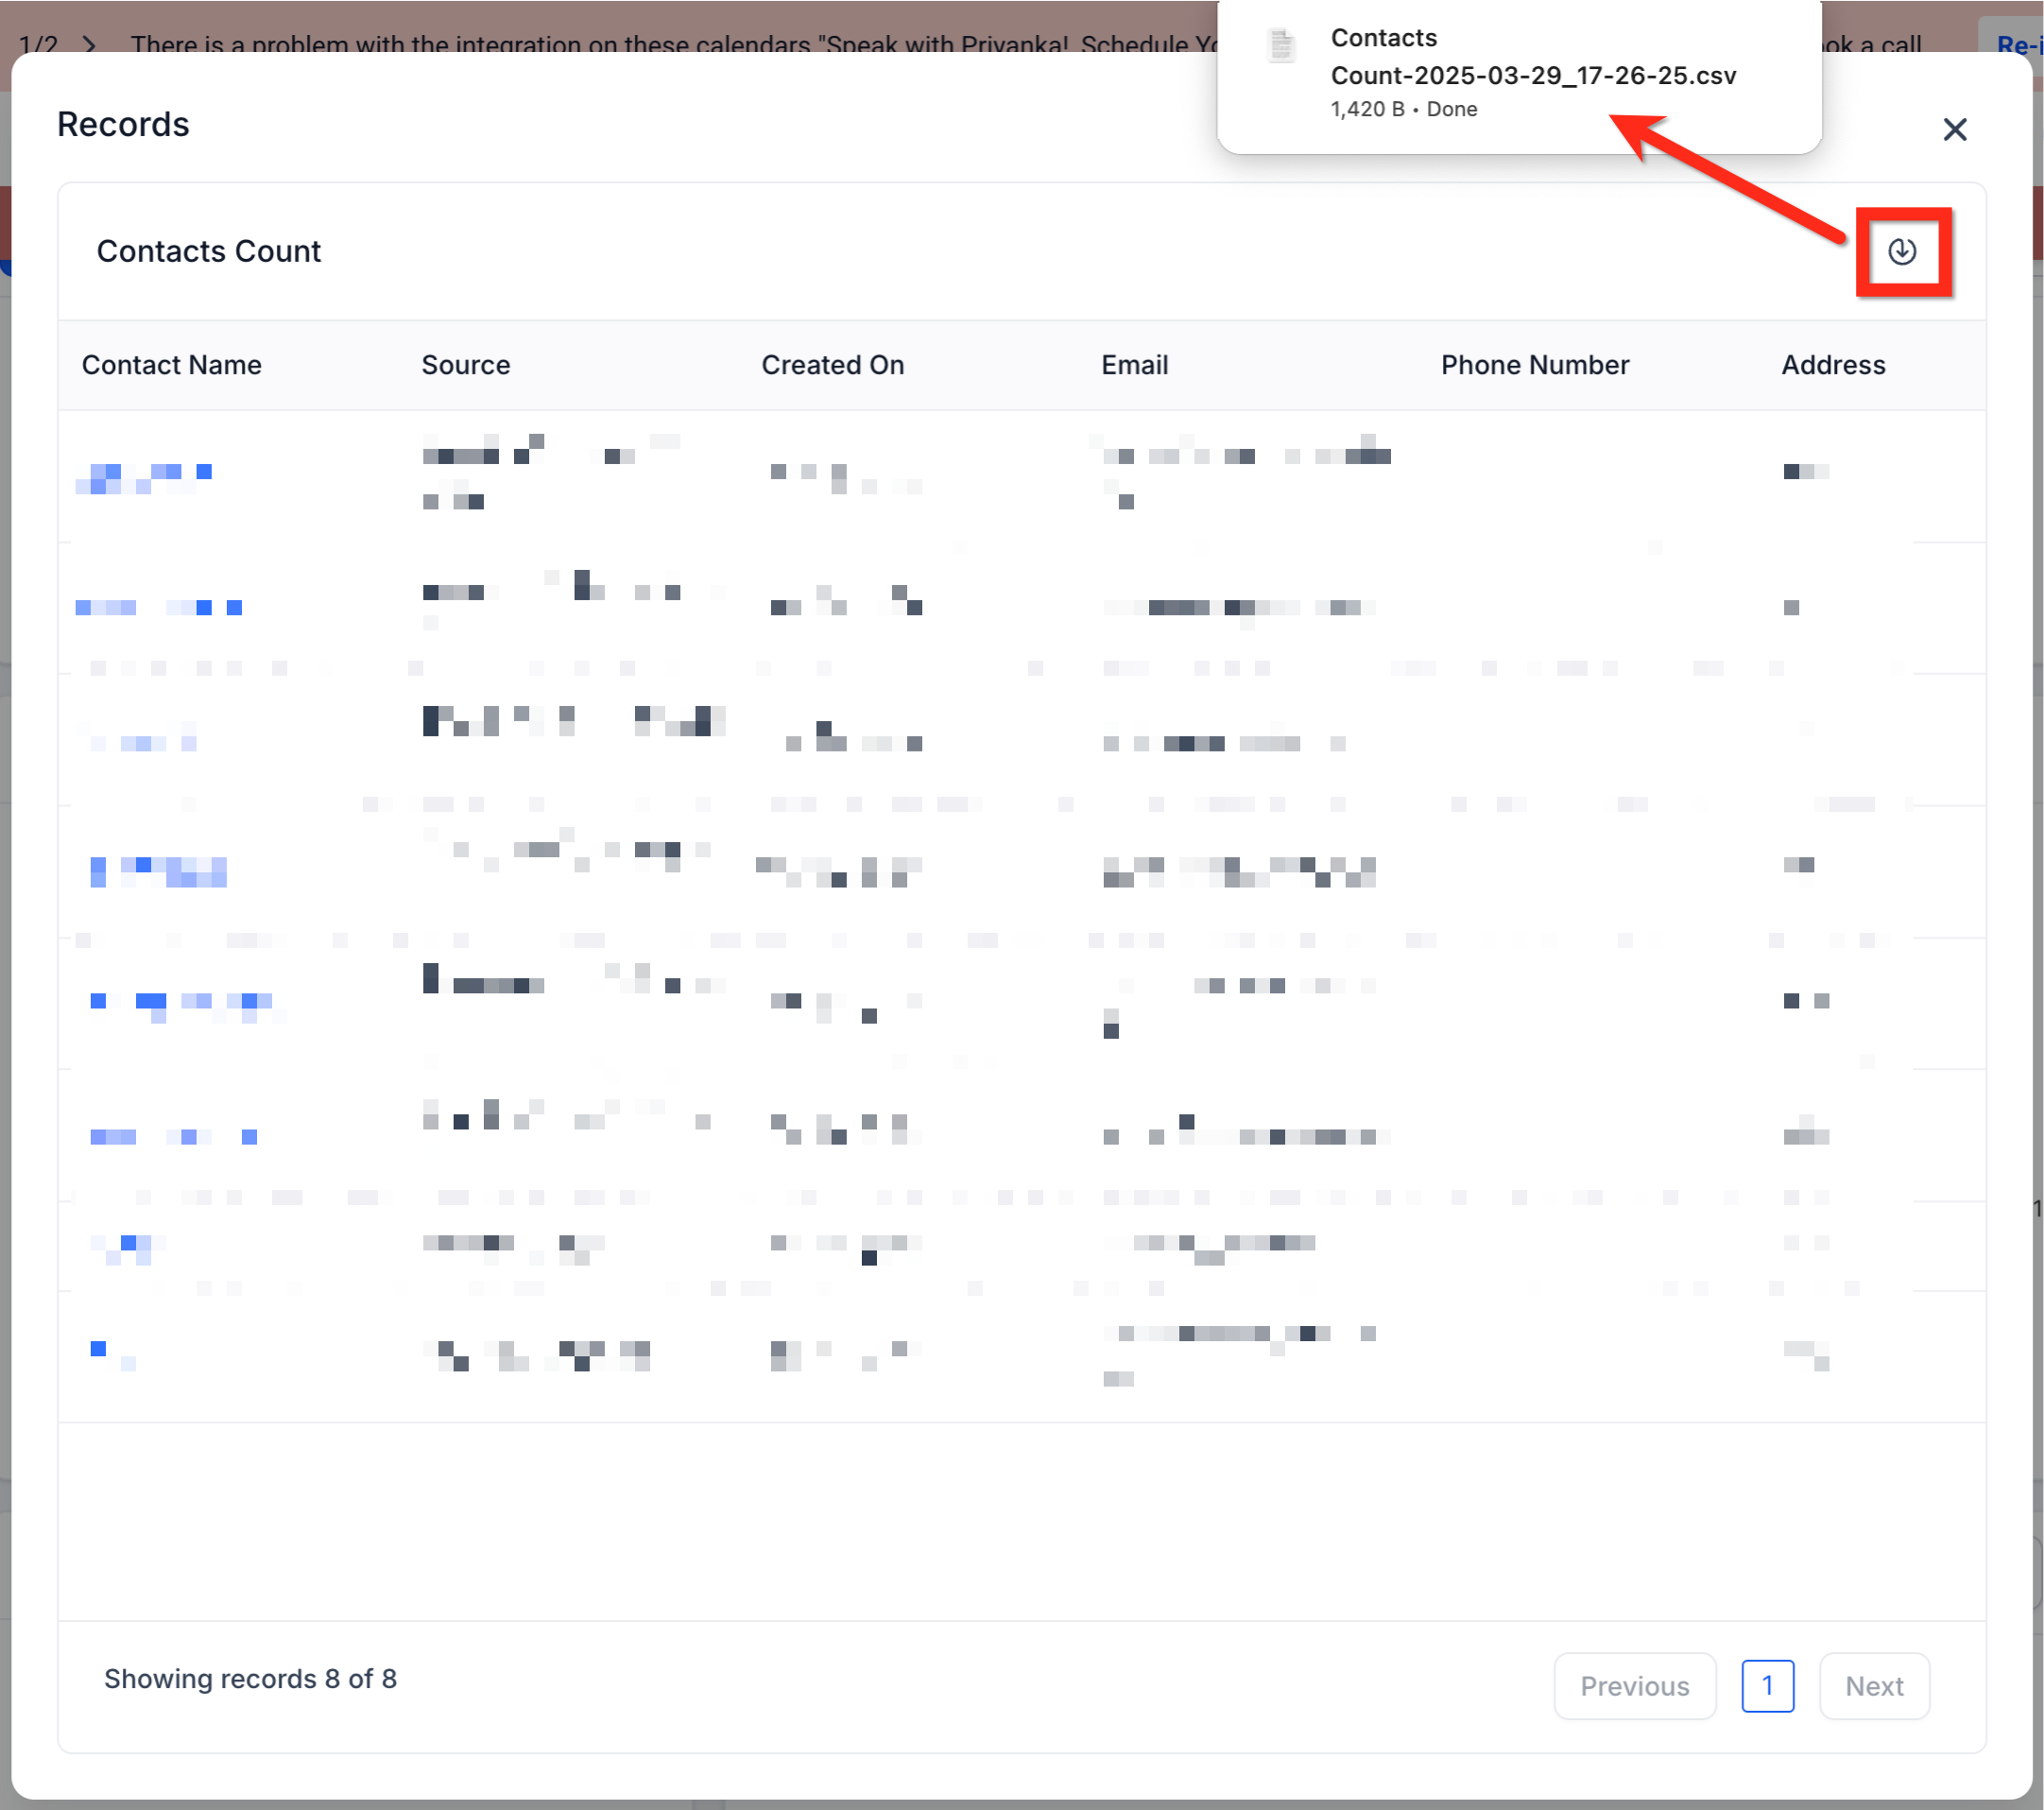
Click into the numbers. Click any widget to open the records behind it, and use Export if you want to work with the data in a spreadsheet.
Refresh when needed. Click the refresh icon to reload every widget. Hover over it to see when the data was last refreshed.
To share the numbers with someone who doesn't log in to MarTech, such as a business partner, use the Send as report option (the paper-plane icon). It copies your dashboard's widgets into a custom report you can export, send, or schedule. The report is a separate copy, so later changes to the dashboard won't update it.
Examples
A home services company checks its dashboard every Monday morning. The top row shows 32 new leads last week, up from 25, but the appointments row shows bookings flat. The owner looks at follow-up speed before changing any ads.
A marketing lead at a consulting firm reviews a monthly dashboard with comparison ranges turned on for every widget. Conversion Rate filtered to the sales pipeline shows a drop, so the team reviews lost deals before the next planning meeting.
A fitness studio keeps No Show Rate Over Time next to Booked Appointments, with a comparison range and the trend set to "Decrease is positive," so the badge turns green when the new reminder texts start working.
Wrapping up
A useful marketing dashboard starts with a short list of questions, not a long list of widgets. Pick the KPIs that matter for your lead flow, pipeline, and appointments, add them from the Widget Gallery, configure each one with clear titles, the right pipeline, and comparison ranges, and arrange them in the order your leads move. Set it as your default, and your key numbers are waiting every time you log in.
Want to see MarTech in action? Book a live demo.
